- intelliBRAND Newsletter
- Posts
- ⚔️ Your Secret Weapon for A+ Content
⚔️ Your Secret Weapon for A+ Content
Let ChatGPT structure clear, credible comparison charts for you.
⭐ The AI Hack That Makes Your Product Look Better
You're reading the free version – upgrade to premium
Hey there!
‘Which one should I buy?’
That’s what your customers are thinking when they land on your listing.
Comparison = clarity.
And clarity = conversions.
❌ But here’s the issue: most sellers either don’t use comparison charts or they make them with generic, boring data.
With ChatGPT, you can generate, structure, and refine high-converting product comparison charts—without wasting hours on spreadsheets.
Let’s walk through how to do it.
STEP 1: Define What Matters to the Buyer
Before you build the chart, start with buyer psychology.
Don’t guess—ask ChatGPT what your audience is really evaluating when choosing between products like yours.
Prompt:
“List the 10 most important decision-making criteria buyers care about when comparing [your product type] on Amazon. Focus on what influences buying decisions.”
Here are some examples from ChatGPT for water bottles:
Capacity
Material (BPA-free?)
Temperature retention
Leakproof design
Easy to clean
Collapsibility
Warranty
Weight
Color options
Price range
STEP 2: Ask ChatGPT to Build the Chart Structure
Once you have your key features, turn them into a comparison table.
Prompt:
“Create a product comparison chart with the features above, comparing my product vs. 2 main competitors. Format it as a markdown or HTML table for easy export.”
You can then ask:
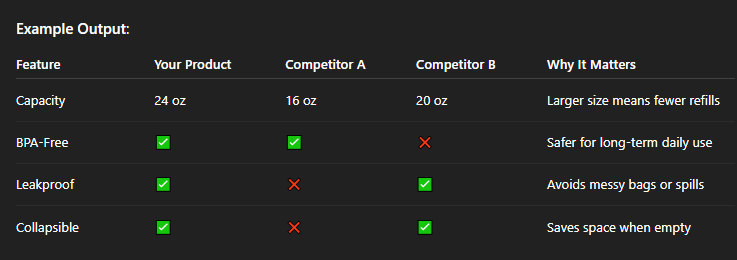
“Add a column for ‘Why it matters’ that explains each feature in customer-friendly language.”
This makes your chart educational, not just a data dump. Here’s an example:

STEP 3: Make It Bias-Free or Biased (Your Choice)
Want a neutral chart to build trust? Or a chart that positions your product as the best?
Use these 2 variations of prompts:
✅ Neutral: “Make this a fair, unbiased comparison using data from top Amazon listings.”
✅ Biased Toward Your Product: “Make this comparison highlight the advantages of my product in a subtle way, without making the competition look bad.”
💡 Tip: Highlight unique features with stars, ticks, or icons to guide the eye.
STEP 4: Optimize for Visuals
Buyers don’t just read your chart—they scan it.
That’s why turning your table into a clean, branded graphic is essential for A+ Content, image stacks, and even sponsored ad creatives.
Prompt:
“Turn this comparison table into a visual layout description for a designer. Include which colors to use for highlights, icons to include, and what emotional tone to convey (trust, innovation, etc).”
Use the output as a brief for your graphic designer or Canva template.
STEP 5: Create a Mini Chart for Mobile Viewers
Charts look great on desktops. But on mobile? Not always.
That’s why you need a condensed version with 3–5 key differentiators—perfect for bullet points, short visuals, or mobile-focused A+ modules.
Prompt:
“Summarize this comparison chart into a short, mobile-friendly version with only the top 3–5 key points.”
Now you’ve got two versions—desktop and mobile-optimized—for maximum clarity across devices.
🧠 RECAP
✔ Use ChatGPT to define what buyers care about
✔ Build charts comparing your product with competitors
✔ Choose neutral or branded comparison angles
✔ Turn tables into visuals for A+ content and images
✔ Create mobile-friendly versions for better UX
Most sellers skip this step.
That’s why their listings feel generic—and yours will feel strategic.
Use ChatGPT to turn product research into conversion power!
What about you:
Have you ever added a comparison chart to your A+ content? If so, did you notice any boost in conversions or engagement?
Reply and let me know what’s your opinion about them.

💡 Never miss out on important updates from the AI world:
1. ChatGPT is getting more shopper friendly (source)
OpenAI rolled out updates to shopping queries in ChatGPT to make it easier for shoppers to find, compare and buy products as more consumers are turning to generative AI tools for purchases.
Now users can find product recommendations with improved product results, citations, visual product details, pricing, reviews and direct links to buy.
2. What Sam Altman Told OpenAI About the Secret Device He’s Making With Jony Ive (source)
Sam Altman has briefed OpenAI staff on his secretive project with former Apple designer Jony Ive: a new AI-powered hardware device that could revolutionize how people interact with AI.
The project, backed by SoftBank and still in early development, aims to offer a more natural, ambient computing experience—moving beyond screens and keyboards.
Altman envisions the device as a major evolution in AI-human interaction, similar in ambition to the iPhone’s impact on mobile computing.
💎 Premium-Only Content
🔐 Still on the free version of our newsletter?
Premium subscribers are already getting next-level insights, viral content prompts, and AI-driven strategies.
Upgrade now for just $4.95/month and stay ahead in the digital landscape.
🥇 intelliBRAND TIP for VIPs
Unlock the VIP secret! Share our awesome newsletter with 2 friends using the button below, and when they sign up, you'll become a VIP with exclusive access to a super special tip with every email! 🌟
Share intelliBRAND Newsletter with your Amazon and eCommerce Seller friends
You currently have 0 referrals, only 2 away from receiving Newsletter VIP Section Access.
Or copy and paste this link to others: https://newsletter.intellibrand.info/subscribe?ref=PLACEHOLDER
The Motivational Corner
🎯 "A goal is not always meant to be reached; it often serves simply as something to aim at." – Bruce Lee
How did you like today's email?Your feedback helps us create even better content for you. |
This is all for today.
Looking forward to connecting with you again.
Keep exploring and leading the way!
Warmest regards,
Larisa
Chief Marketing Officer, intelliBRAND
P.S. If you’ve missed last week’s issue, you can find it here.

